Aug 2023
—
Sept 2024
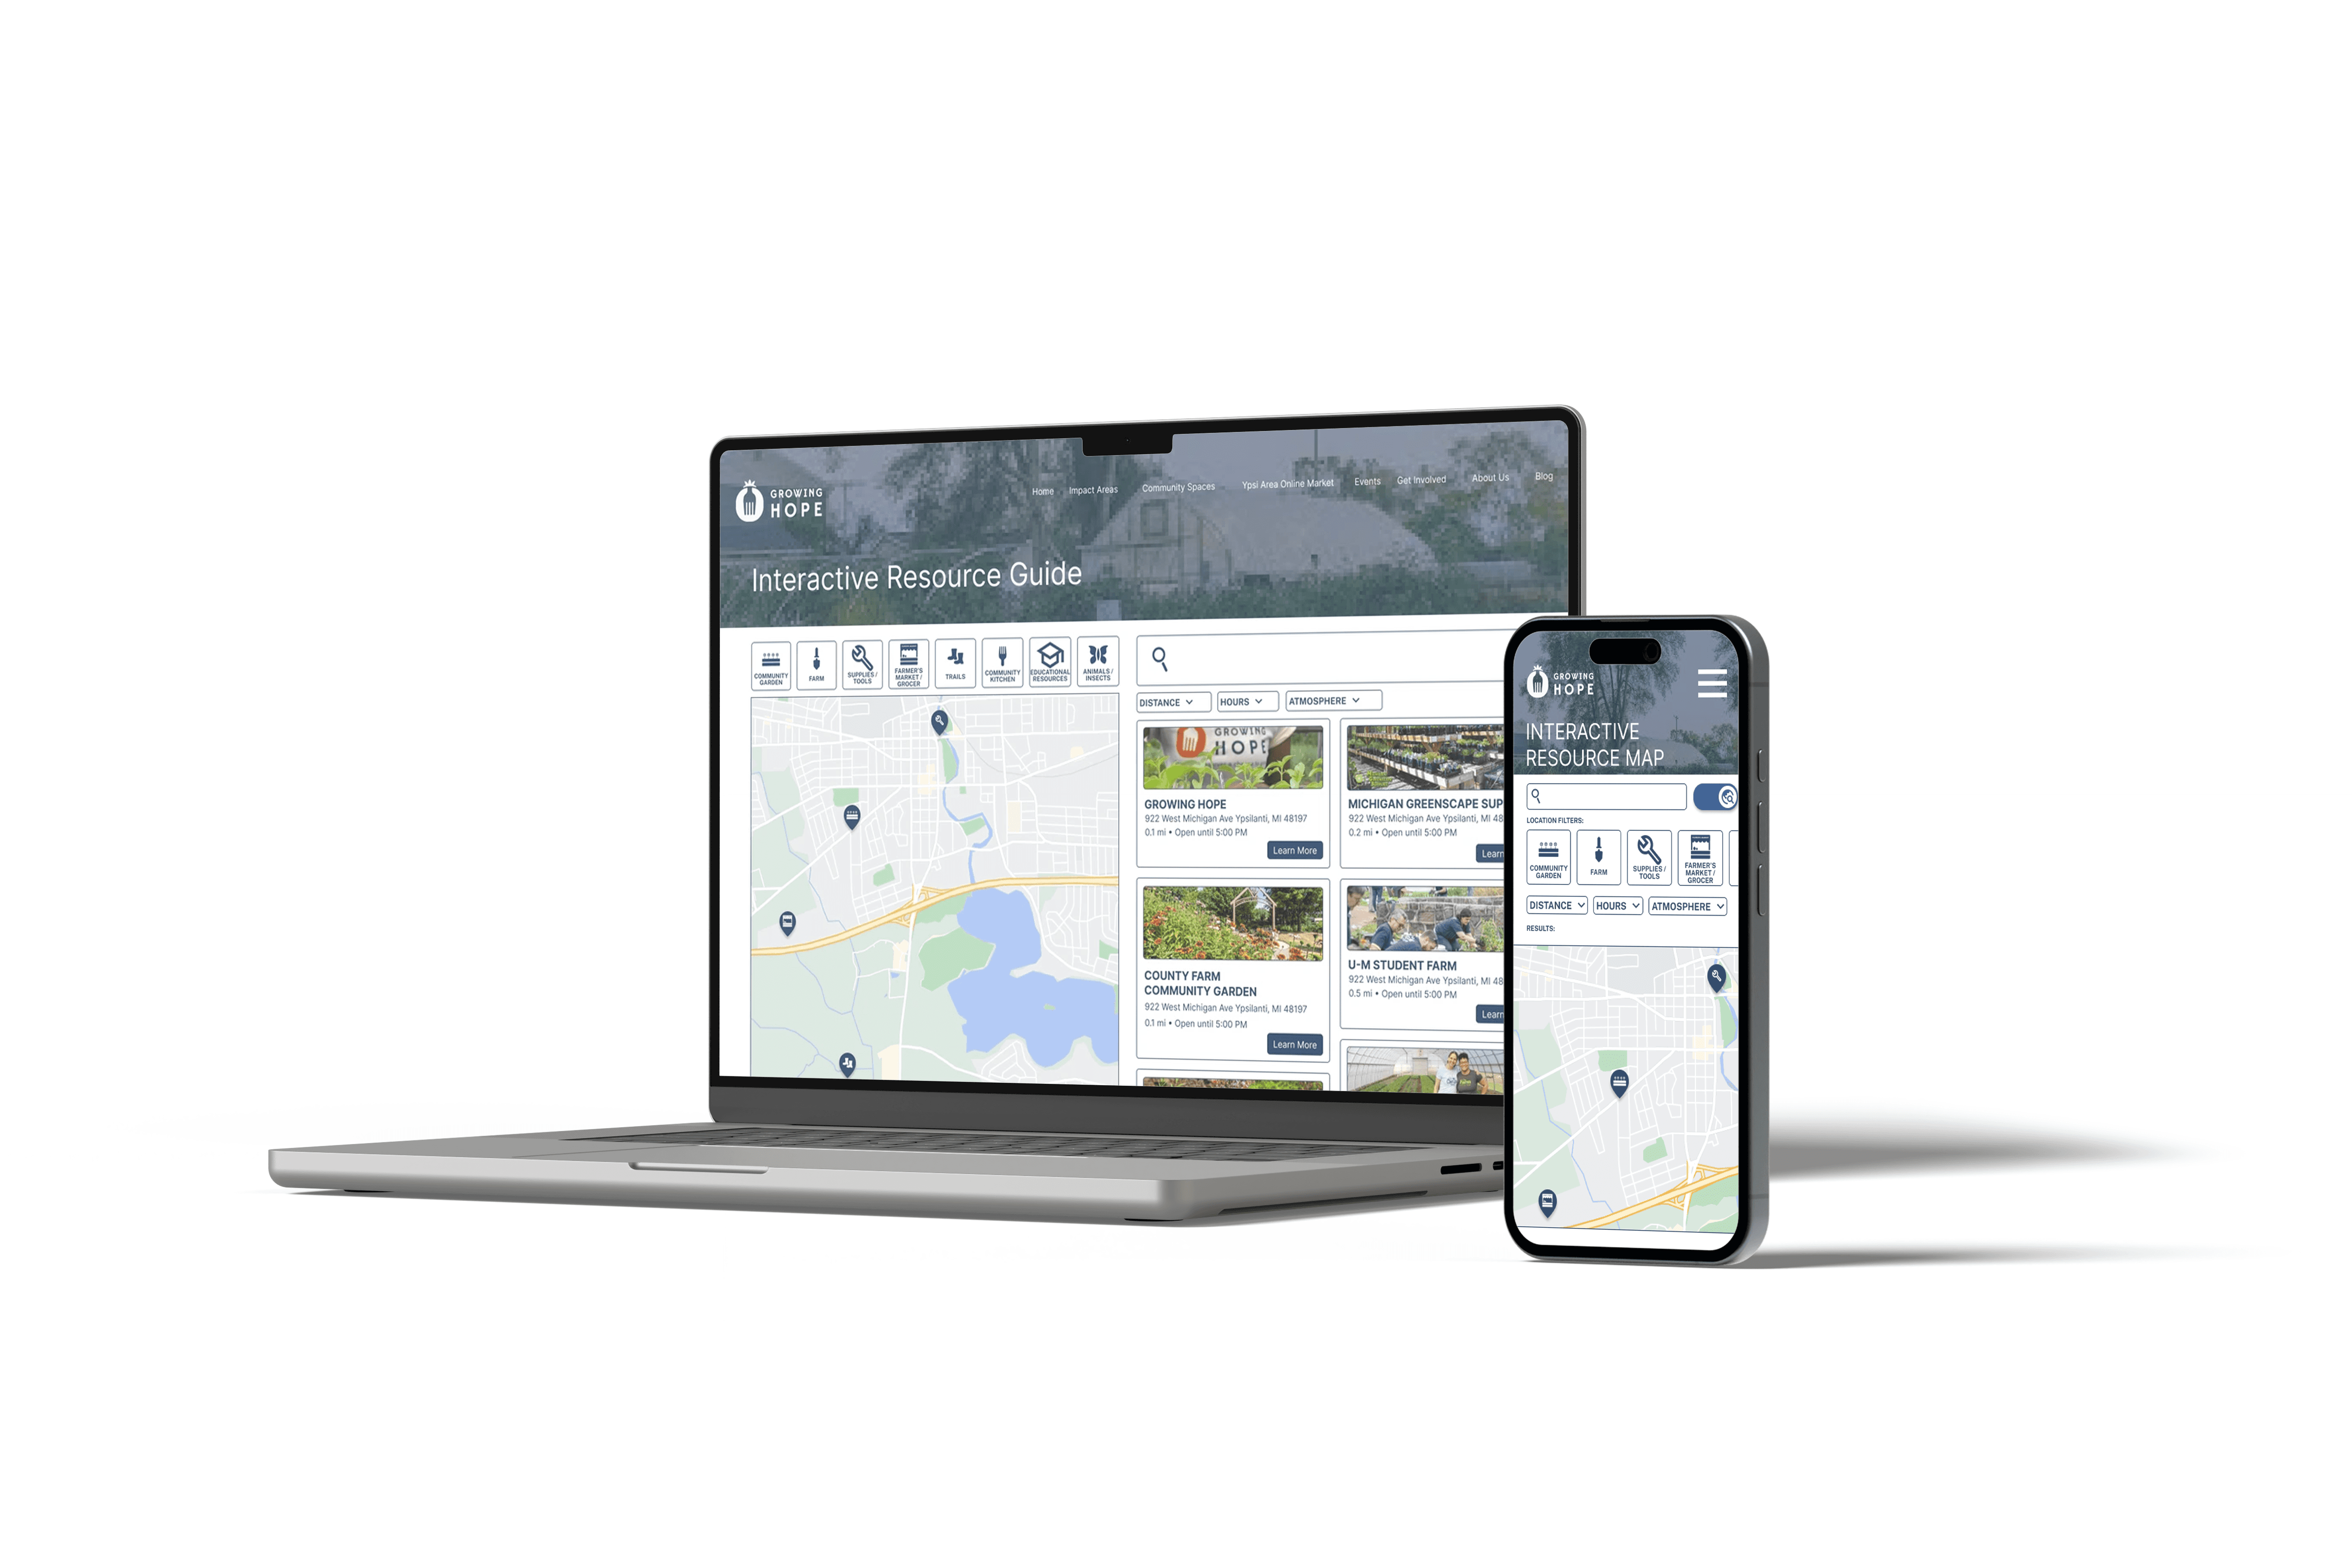
Growing Hope Interactive Food Map
Context
Since its conception in 2003, Growing Hope has worked alongside the Ypsilanti community to strengthen and support the local food system. Growing Hope seeks to connect food sovereignty with transformation, learning, justice, equity, integrity, and placemaking. One of the ways they pursue their mission is by providing a resource guide of affordable, fresh food sources and gardening resources in the local Ypsilanti area to promote sustainable food systems that are accessible to all.
An outdated map & no one to read it
There are 4 different out-of-date versions of Growing Hope’s resource guides/maps available, but the current state of the guide is not reaching its expectations. It is difficult for Growing Hope employees to update the guides from the backend, and all these guides are hard to locate for users.
Goals
Create a new resource guide that users can easily access and comprehend
Merge information from the 3 various versions currently available
Have a new resource guide that is easy to update from the backend
Incorporate Growing Hope’s network of 500+ home growers into the new solution
Ensure the map is printable and responsive to desktop, mobile, and tablet views
Mapping out an easier way to keep up the map
We conducted interviews with both Growing Hope employees who interact with the backend of the food map and employees who were entirely unfamiliar with the map to learn more about the needs and pain points of the food map internally. The data collected from these interviews aligned with our goal to increase employee ease of updating the map information, and aided us in improving their current experiences. (Here’s our interview guide if you’re curious!) From there we were able to identify general themes and coded them into a chart:

Surveying garden coordinator and resource users for feedback
We distributed surveys to both the community garden coordinators and the resource guide users through Growing Hope’s contact list. We wanted to hear about food map users’ experiences with the resource: what they typically utilize it for, what they like and dislike, and learn more about user behavior overall. We administered a separate survey to the community garden coordinators to see what information they found most important to be shared with users, but found that it was difficult to get responses.
Stepping into the user's shoes
From the data collected from our interviews and surveys, we were able to develop user personas and a user journey map. Our user personas represented the two main categories of users that would benefit Growing Hope’s resource guides— gardeners/farmers and consumers.


Design Requirements
Based on our interviews with Growing Hope employees, we compiled a design requirements document that describes some of our client’s requirements, wants, and needs for their ideal map. These helped transition to the design phase!

Sketches &
Wireframes
Drafting the early ideas
Our early ideas were primarily inspired by benchmarking several websites with interactive maps, including Airbnb, Zillow, the University of Michigan’s campus map, and a map of farmers markets in Michigan that was sent to us during one of our Growing Hope employee interviews.

Our team developed some low-fidelity wireframes based on these initial sketches and our benchmarking. We made multiple variations and followed up with a cognitive walkthrough to determine the final layout.


Cognitive
Walkthrough
To learn what specific features users liked on all of the benchmarked platforms, our team conducted usability evaluations on all four of the benchmarks by conducting a cognitive walkthrough, asking users what they liked about the interfaces and what they would change.
We found that users wanted…
Color coding and a simplistic filtering bar on top of the page
Incorporated grouping of pins when zoomed out
Responsive mobile designs
List view of locations in addition to map view
Search function and other sorting options
Mid-Fi Wireframes

Usability Testing
Our team conducted usability testing of these designs with current users of the guides. For the testing, we created a usability test log and a test plan to record the tasks, script, rationale for testing, a user’s ranking of task difficulty, the number of errors a user took performing the task, and the time it took for a user to perform the task.
The main feedback we received from our tests:
The category filters did not seem to be clickable options to the users
The location tags in our mid-fi appeared clickable, but are not
Confusion surrounding the labels on our icons— what distinguishes a farm from a garden and what “nature” means
High-Fi Mockups


Feedback
& A/B Testing
After completing the usability testing of the mid-fidelity prototypes, the team also gauged feedback on the first iteration of our high-fidelity design from peers and experts in the field. The following changes were made:
The map to list view button was changed to a toggle for better visibility
Icons on the map were change to pins to match industry standards
Location tags were removed to reduce confusion
The advanced filters popup was replaced by drop down menus
Text color was changed to dark blue for better accessibility
We A/B tested the map to list view toggle and buttons and found the toggle was preferred.
Prototyping
To plan out interactions, we created a site map and then put together our high-fidelity prototype.


Presentation
& Implementation
We presented our final designs to our client and peers at the University of Michigan School of Information Design Expo.
We were also very lucky to be able to continue our work with Growing Hope beyond this capstone project as freelance UX designers to implement our designs into their website. Given the constraints of having to develop the interactive food map for a Wordpress website without plugin compatibility, we had to adapt our designs visually, but we kept our foundational work and met all our design requirements.
You can check out the finished map here. An article was also published about the impact of our map on the Ypsilanti community and you can find that here!
